Gold prices slipped in the morning, retreating from recent record peaks in anticipation of key U.S. labor data that is likely to factor into the outlook for interest rates. A key technical indicator for spot gold prices also showed that buying momentum was running dry after a strong run-up through March and early-April. Still, the yellow metal may benefit from increased safe haven demand, especially with the prospect of worsening geopolitical conditions in the Middle East amid saber rattling between Iran and Israel.
A recovery in the dollar also pressured gold, as the greenback rose tracking a slew of hawkish comments from Federal Reserve officials. Gold’s 14-week relative strength index- which gauges buying and selling momentum for the Gold- showed spot prices were well within overbought territory. The RSI rose as high as 82 earlier this week, and was currently at about 74.9- indicating that the Gold remained overbought despite Friday’s price losses.
Spot gold fell 0.6% to $2,277.10 an ounce after hitting a record high of $2,305.31 on Thursday, while gold futures expiring in June fell 0.6% to $2,295.50 an ounce by 00:03 ET (04:03 GMT), after hitting a record high of $2,325.30 an ounce on Thursday.
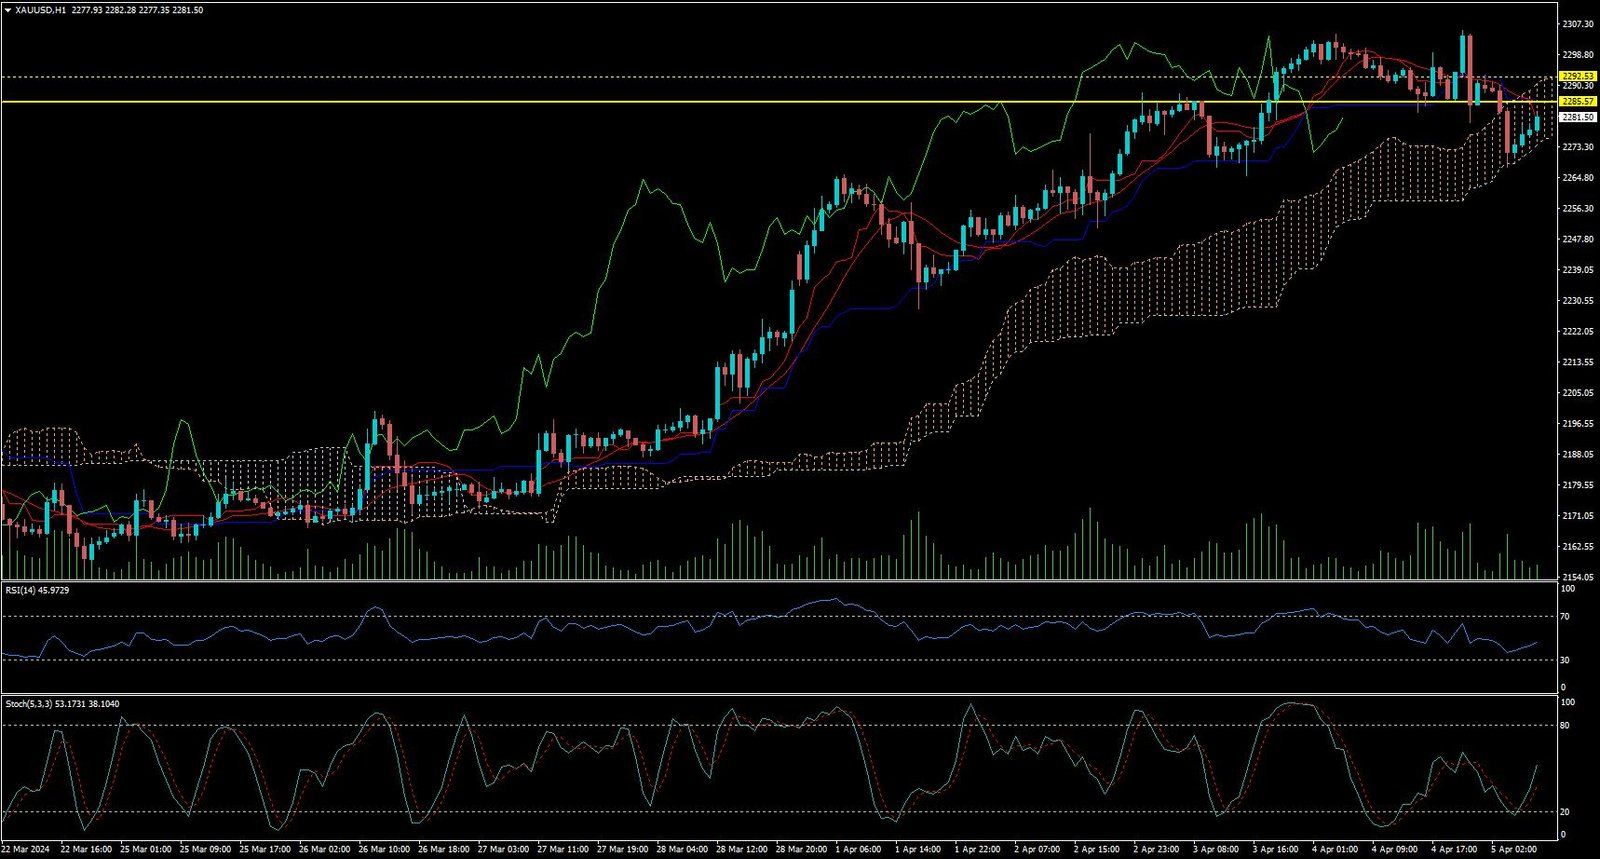
CURRENTLY GOLD IS MOVING ON DOWN TREND.
Expecting correction up to 2285.60
Today’s important levels for trading are 2304.14, 2292.02, 2278.60 AND 2266.48
Trading Strategy for today: Sell on Rise
Trade setup:
Pullback Sell around 2285 Higher Sell around 2292.50
Safe swing sell below 2267.50
Safe swing buy above 2304.50
Important Event :
🔴Average Hourly Earnings m/m,
🔴Non-Farm Employment Change,
🔴Unemployment Rate